
The short answer. Past a certain workload, a small rise in how busy a team is causes a large rise in how long everything takes. Measure elapsed time rather than effort, cut the waiting and the variability, and add people only after that.
Delay does not rise in step with workload. Past a certain point, a small increase in how busy a business is produces a large increase in how long everything takes. There is usually no lazy person to find.
Consider a business of five people. Everybody is working. Nobody is idle, nothing is being neglected, and there is no obvious slack anywhere in the week.
Everything is also late. Not catastrophically, and not always the same thing, but consistently. Quotes take four days instead of one. A change a customer asked for on Monday is done a week on Thursday. The team is doing more than it did last year and is slower than it was last year, which feels like it should not be possible.
The usual explanations arrive in order. People need to be better organised. The systems are not good enough. Somebody is not pulling their weight. Occasionally one of these is true. Very often none of them is, and the business is simply experiencing a piece of mathematics that almost nobody is taught.
Why does work slow down when a team is busy?
In 1961 the mathematician John Kingman published an approximation for how long things wait in a queue. It has three parts, and the first one is the part that matters here. Average waiting time scales with a term that divides how busy the system is by how busy it is not.
Run that term and the numbers stop behaving the way intuition expects.
At 50 per cent busy, the multiplier is 1. At 80 per cent it is 4. At 90 per cent it is 9. At 95 per cent it is 19.
Read the last two together. Going from 90 per cent busy to 95 per cent busy is a 5 per cent change in workload. It roughly doubles the waiting.
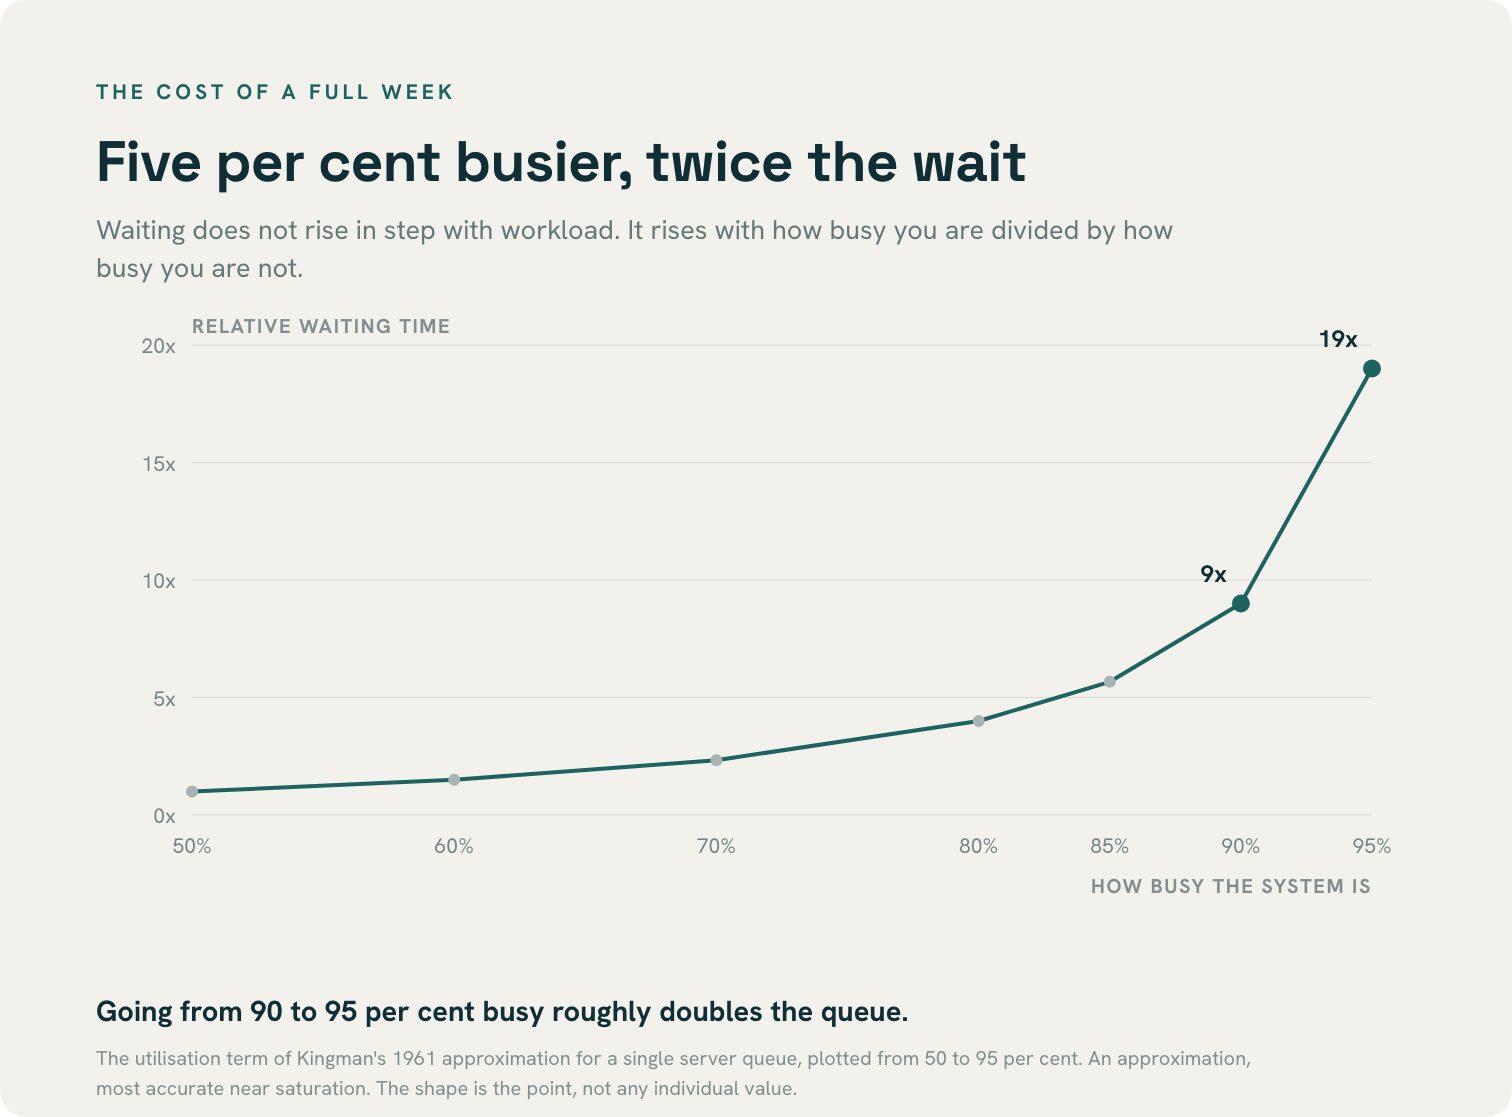
The approximation is exactly that. It describes a single server queue, it is most accurate as a system approaches saturation, and a five person business is not a queue in a textbook. Kingman’s formula will not predict Thursday.
What it does explain is the shape of the experience: why a business can add a modest amount of work and see delays that seem wildly out of proportion, and why the same business can shed a small amount of work and feel transformed. The relationship was never a straight line. Nobody in the business did anything differently. They crossed a bend in a curve.
The same curve, measured in hospital beds
This is not only a theoretical concern, and the best documented example in Britain has nothing to do with small businesses.
In 1999 Bagust, Place and Posnett published a stochastic simulation of hospital bed use in the British Medical Journal, modelling what happens to emergency admissions at different levels of occupancy. Summarised in NICE’s later evidence review, the proportion of days on which at least one patient needing immediate admission could not be accommodated was close to zero below 85 per cent occupancy, around 1 per cent at 90 per cent occupancy, and rose to 19 per cent at 100 per cent.
That is the same curve. The difference between a hospital that is 90 per cent full and one that is completely full is not a tenth more pressure. In the model it is the difference between a bad day every few months and a bad day most weeks.
The caveats belong in the article rather than in a footnote, and they are NICE’s own. The model is theoretical. NICE notes that it is unlikely to reflect current practice in the NHS, that it predates significant changes in how hospitals are organised, and that optimal occupancy varies by size, case mix and season. Its committee settled on 90 per cent as a pragmatic maximum rather than the 85 that gets quoted.
Take the curve and leave the number. The exact threshold belongs to hospitals in the 1990s. The behaviour belongs to anything with a queue in it, which includes almost every business.
Variability is the second term, and the one you can actually change
Kingman’s approximation has a middle term that is easy to skip past. Waiting also scales with how variable the work is: how unevenly it arrives, and how unevenly long each piece takes.
This is why two businesses of the same size, carrying the same workload, can have completely different reputations for reliability.
A business where jobs arrive in an unpredictable rush and range from two hours to two weeks will wait far longer, at the same level of busyness, than one where work arrives steadily in similar sized pieces. Neither is working harder. One has a smoother input.
That matters because utilisation is often not within the owner’s gift. Turning work away is expensive and sometimes impossible. Variability is frequently more tractable than it looks. It rarely appears on anybody’s list of problems, because it does not present as a problem. It presents as a busy week.
Why small businesses run hot
None of this is difficult to accept in the abstract. It is difficult to act on, because of an asymmetry in what an owner can see.
An idle hour is visible. It has a person attached to it, it appears on a timesheet, and in a business that bills by the day it looks exactly like money not earned. A week where everyone is flat out looks, from the owner’s chair, like a week that went well.
Queue time is invisible. Nobody records the four days a job spent waiting for one person to look at it. It does not appear in any report, it costs nothing that can be counted, and it is paid for entirely by the customer, who experiences it as the whole of your service.
So the visible cost gets managed and the invisible one accumulates. A business optimising for the first is systematically choosing the second, and will keep choosing it, because the feedback only runs one way.
Slack is not waste. In a system with any variability in it, spare capacity is what absorbs the variability. Remove it and the variability has to go somewhere, and where it goes is into the customer’s waiting time.
What should you do when everything runs late?
Measure the wait, not the work. For the next ten jobs, record two numbers: the elapsed time from request to delivery, and the actual hours spent working on it. The gap between them is the business’s real product as far as the customer is concerned. In most small businesses the gap is embarrassing, and nobody has ever looked at it before.
Reduce variability before capacity. Smaller and more similar pieces of work. A limit on how many things are in progress at once, which is uncomfortable and effective. A predictable point in the week when new work is taken in, rather than continuously. None of this costs anything.
Find the one person everything passes through. Most small businesses have a single point that everything queues at, and it is usually the owner, usually for approval, and usually for approval of things that did not need approving.
This is the most important consequence of the whole curve, and the easiest to miss. Utilisation is not a property of a business. It is a property of each point work has to pass through. A five person business can be running at 60 per cent overall and still have one person sitting at 98, which is a multiplier of roughly 49 against everybody else’s 1.5.
Everything routed through that person inherits their queue rather than the company’s. Which is why a business can add people, genuinely reduce the average workload, and get slower. The average was never what anyone was waiting on.
Then, and only then, add capacity. It is the expensive answer and frequently the first one reached for. A business that hires into a variability problem gets a larger business with the same problem and a higher cost base.
The week is not the measure
There is a version of a business that is busy every hour, turns down nothing, and is slower and less reliable than a version of itself that does slightly less.
That is an unwelcome thing to be told by mathematics, particularly by an owner who has spent several years treating a full diary as evidence that things are going well. It is also the only explanation that accounts for the specific and common experience of working harder than last year and delivering later than last year.
The full week is not the achievement. It is the input. What the customer buys is the elapsed time, and nobody is measuring it.
Take the last job you delivered. How much of that time was anybody actually working on it?